How to Analyze 10-K Filings: A 5-Step Guide for Investors
Quick Answer: What is a 10-K?
A 10-K is an annual report required by the U.S. Securities and Exchange Commission (SEC) that gives a comprehensive summary of a company's financial performance. It includes the company's business overview, risk factors, management's discussion, and three core audited financial statements: the Income Statement, Balance Sheet, and Cash Flow Statement.
Why the 10-K is the Ultimate Source of Truth
A 10-K is not a marketing document. It’s not a press release. It is a legal document, signed by the CEO and CFO, who face personal liability for material misstatements.
Unlike the glossy "annual report" companies send to shareholders, the 10-K is a "warts and all" disclosure. It’s the single best place to understand a company's economic moat, the quality of its earnings, and the specific risks it faces.
This is where you find the details that don't make it into headlines.
A 5-Step Framework for Analyzing a 10-K
Don’t read a 10-K like a book. Use this framework to navigate directly to the most critical sections.
Step 1: Item 1 – The Business
Always start here. Item 1 explains how the company makes money. This section details its main products, services, key markets, and competitive advantages.
What to look for:
- Business Segments: How is revenue broken down? Is the company diversified or dependent on one hit product?
- Customers: Does it mention any single customer that accounts for 10% or more of its revenue? This is a major concentration risk.
- Competition: How does the company describe its competitors and its own position in the market? This is a great, unvarnished look at its true competitive advantages.
Step 2: Item 1A – Risk Factors
This is where the company must legally disclose everything that could go wrong. Your job is to separate the boilerplate risks from the specific risks.
- Ignore: "Our industry is competitive," or "We may be subject to economic downturns." Every company has these risks.
- Focus on: "We are currently in litigation with Company X, which could result in a material loss," or "A recent change in government regulation will significantly increase our compliance costs."
This section provides a clear-eyed view of the potential downside—essential for calculating your margin of safety.
Step 3: Item 7 – Management’s Discussion & Analysis (MD&A)
If the 10-K were a movie, the MD&A would be the director's commentary. This is where management explains the financial numbers in plain English.
This is arguably the most valuable part of the 10-K. Management discusses why revenue grew or shrank, why margins compressed, and what they plan to do in the future.
Pro-Tip: Compare this year's MD&A to last year's. Did management deliver on the strategy they promised 12 months ago? This is a powerful test of leadership's competence and honesty.
Step 4: Item 8 – The Financial Statements
This is the "proof." After reading management's story in Item 7, you come to Item 8 to verify it with the raw, audited numbers. This section contains the three crucial statements:
- Income Statement: Shows revenues, expenses, and profits (Net Income).
- Balance Sheet: Shows assets, liabilities, and equity at a snapshot in time.
- Cash Flow Statement: Shows how cash moved in and out of the business.
Your goal here is to connect the narrative to the numbers. If management claimed "strong consumer demand" in the MD&A, you should see a corresponding increase in Revenue (Income Statement) and, ideally, Cash Flow from Operations (Cash Flow Statement).
Step 5: The Notes to Financial Statements
The numbers in Item 8 tell you what happened. The Notes (which are technically part of Item 8) tell you how management counted those numbers.
This is the "fine print" where the real analysis takes place. You don't need to read every note, but you must scan for:
- Revenue Recognition: How does the company decide when to book a sale? Aggressive policies here can inflate revenue.
- Inventory: How do they value their inventory (LIFO vs. FIFO)? A change in this policy can artificially boost profits.
- Debt: What are the interest rates and maturity dates (debt covenants)?
- Legal Proceedings: Are there any major lawsuits that aren't fully provisioned for?
The "Hard Way" vs. The "Finmode Way"
This 5-step process is thorough, but it’s also time-consuming. A proper 10-K analysis for a single company can take hours, even for a trained professional. You have to read, cross-reference, and manually calculate ratios to find the red flags.
This is the "hard way."
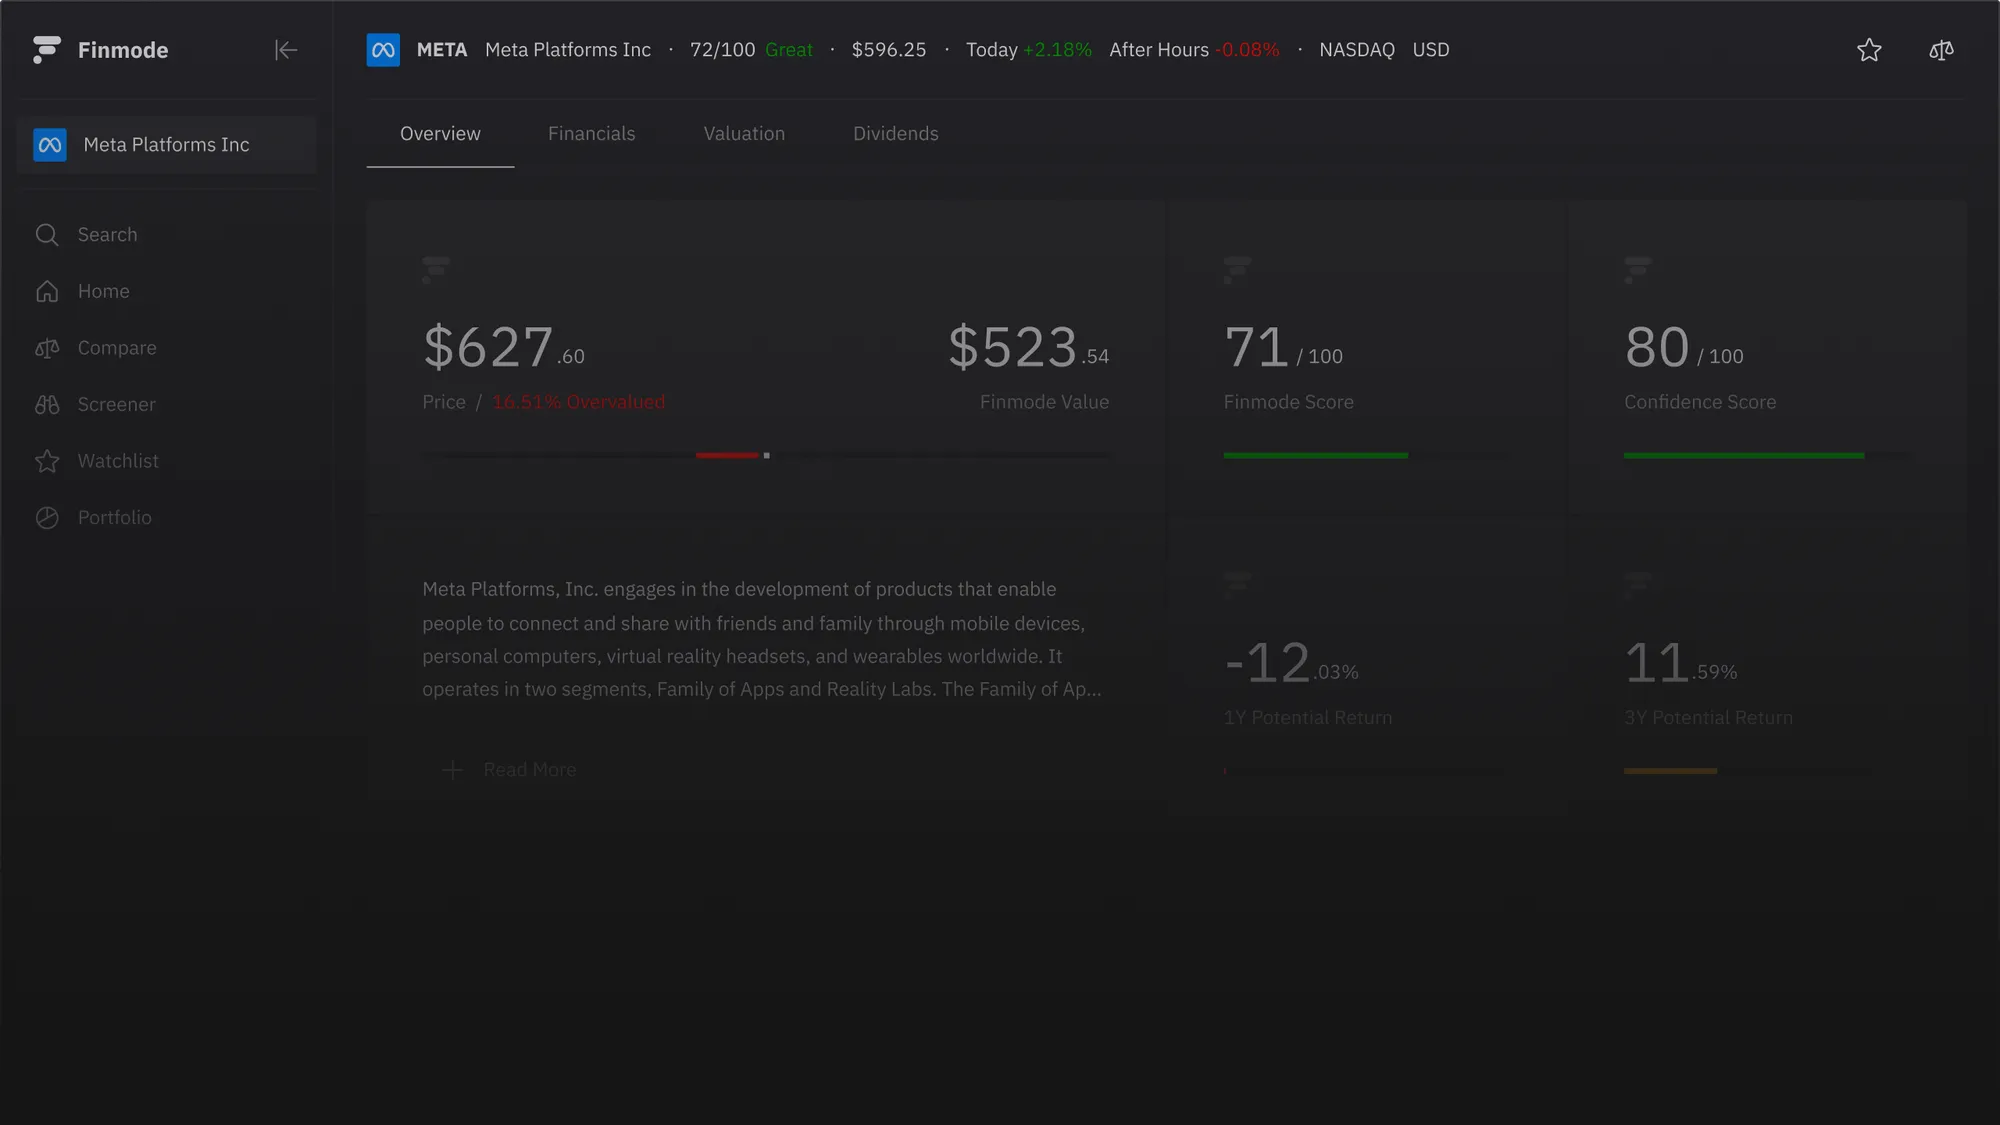
This is precisely why we built Finmode Scores. Our platform does this heavy lifting for you.
Finmode analyzes the 10-K for you in seconds.
Our system ingests these complex filings and automatically analyzes a company's profitability, financial health, valuation, and moat. It flags the key risks, identifies accounting red flags, and benchmarks the company's metrics against its peers.
Instead of spending three hours digging through Item 8 notes to assess debt levels, our Finmode Scores give you an objective analysis of Financial Health instantly. We turn 100 pages of text into a clear, actionable score, so you can spend your time making decisions, not digging for data.
Key Red Flags to Look For in a 10-K
As you analyze, keep an eye out for these common warning signs:
- Divergence Between Net Income and Cash Flow: A company reporting high Net Income (profits) but negative or low Cash Flow from Operations (CFO) is a massive red flag. It means profits aren't turning into real cash.
- Frequent Changes in Accounting Policies: If a company changes how it accounts for inventory or depreciation every few years, it may be trying to "manage" its earnings.
- Complicated "Special Items": Watch out for companies that constantly have "one-time" restructuring charges or other "unusual" expenses. At some point, they are no longer "one-time."
- Growing Inventory or Accounts Receivable: If inventory or receivables are growing much faster than revenue, it could mean the company can't sell its products or collect its bills.
Conclusion: Read Less, Understand More
Analyzing a 10-K is an essential skill for any serious investor. It's the only way to cut through the market noise and build conviction based on facts.
Use the 5-step framework to do it efficiently. Start with the business, check the risks, read management's story, and then verify it all with the numbers and the notes.
And when you're ready to do it in seconds instead of hours, let Finmode do the analysis for you.
Read more insights
Try Finmode Today
Free To Get Started
While we strive to provide accurate and reliable information, the content provided on this platform is for informational purposes only and should not be construed as financial advice. The information contained herein is based on data and analysis that we believe to be accurate and reliable, but it is not guaranteed to be complete or error-free.
No Investment Advice:
The information provided does not constitute a recommendation to buy, sell, or hold any security. Any decision to invest in any security should be made based on your own research and analysis, or with the assistance of a qualified financial advisor.
Risk of Loss:
Investing in stocks involves significant risk, including the potential for loss of principal. Past performance is not indicative of future results.No
Warranty:
We make no warranties, expressed or implied, as to the accuracy, completeness, or reliability of the information provided. We are not liable for any losses or damages, direct or indirect, arising from the use or reliance on the information provided.
User Responsibility:
It is your sole responsibility to evaluate the accuracy, completeness, and reliability of the information provided and to make your own investment decisions.
FINMODE S.R.L - DOGLIANI (CN) PIAZZA VITTORIO GRASSO 12 - P.IVA 04164500045 - N.REA CN - 340581 - CAP. SOCIALE 15000€