Intrinsic Value Calculation: A Step-by-Step Guide for 2026
Mastering intrinsic value calculations is what separates investing from speculating. It provides the rational, analytical anchor needed to make intelligent decisions when the market is behaving irrationally.
This guide provides a practical, step-by-step walkthrough of the most respected method for calculating intrinsic value: the Discounted Cash Flow (DCF) model. We will break down each component, walk through a simplified example, and then explore other key valuation methods you can use to build confidence in your analysis.
Why Intrinsic Value is the North Star of Investing
Before we dive into the mechanics, it's crucial to understand why this calculation is the foundation of the entire value investing philosophy. As we covered in our Complete Guide to Value Investing, the goal is to buy businesses for less than they are worth. This is impossible without first having a well-reasoned estimate of that worth.
- It Defines Your Margin of Safety: Intrinsic value is the benchmark against which you measure the market price. The difference between your calculated value (e.g., $150/share) and the price you can buy at (e.g., $100/share) is your margin of safety. Without an intrinsic value estimate, a margin of safety is just a guess.
- It Protects You From "Mr. Market": The market is manic-depressive. An intrinsic value calculation acts as your anchor of sanity. When the market panics and prices fall, your analysis tells you whether it's a true crisis or a buying opportunity. When the market is euphoric, your analysis tells you when to be skeptical.
Price is what you pay; value is what you get. The goal of this guide is to teach you how to confidently calculate the "value" part of that equation.
The Gold Standard: Discounted Cash Flow (DCF) Analysis
The Discounted Cash Flow (DCF) model is the bedrock of fundamental analysis. Its premise is simple: a business is worth the sum of all the cash it can generate in the future, with each of those future cash flows "discounted" back to what they're worth today. After all, a dollar today is worth more than a dollar in ten years.
A DCF analysis forces you to think like a business owner, not a stock trader. You'll rigorously examine a company's earning power, capital needs, and long-term prospects. Let's break down the four core steps.
Step 1: Forecast Future Free Cash Flow (FCF)
Free Cash Flow (FCF) is the cash a company produces after accounting for the capital expenditures necessary to maintain and grow its asset base. It's the money that could be returned to shareholders without harming the company's operations.
The formula is:
Your first task is to project the company's FCF over a forecast period, typically 5 to 10 years. This is the most crucial—and most subjective—part of the analysis. You'll need to dig into the company's financial statements (especially the 10-K report) and make informed assumptions about:
- Revenue Growth: How fast will the company grow its sales? Look at historical growth, industry trends, and competitive advantages (its "economic moat").
- Profit Margins: Will the company maintain or improve its profitability?
- Capital Expenditures: How much will it need to reinvest to achieve its projected growth?
Step 2: Determine the Discount Rate (WACC)
Once you have your FCF projections, you need a discount rate to bring them back to their present value. The most common discount rate used is the Weighted Average Cost of Capital (WACC).
WACC represents the blended cost of a company's financing—from both debt holders and equity holders. It's essentially the minimum rate of return the company must earn on its assets to satisfy its creditors, owners, and other providers of capital. A higher WACC means future cash flows are worth less today, resulting in a lower intrinsic value.
The formula looks complex, but it's just two parts: the cost of equity and the cost of debt.
Where:
- E = Market Value of Equity
- D = Market Value of Debt
- Re = Cost of Equity
- Rd = Cost of Debt
Step 3: Calculate the Terminal Value
A business doesn't stop generating cash after your 5 or 10-year forecast period. The Terminal Value (TV) is an estimate of the company's value for all years beyond the explicit forecast period. There are two primary methods:
- Exit Multiple Method: This method assumes the business is sold at the end of the forecast period at a multiple of its earnings (e.g., an EV/EBITDA multiple). This multiple is usually based on what similar companies are trading at in the market today.
- Perpetuity Growth Model (Gordon Growth): This method assumes the company's FCF will grow at a stable, constant rate forever. This growth rate should be conservative—typically between the long-term inflation rate (2%) and the long-term GDP growth rate (3-4%). In this method, 'n' is the final forecast year and 'g' is the perpetual growth rate.
Step 4: Calculate Intrinsic Value Per Share
This is the final assembly step.
- Discount all cash flows: Take each year's projected FCF and the Terminal Value and discount them back to the present using your WACC.
- Sum the present values: Adding up these discounted values gives you the company's Enterprise Value (EV).
- Calculate Equity Value: To find the value available to shareholders, you adjust for debt and cash. Equity Value = Enterprise Value - Total Debt + Cash & Cash Equivalents.
- Find Intrinsic Value Per Share: Divide the Equity Value by the number of diluted shares outstanding.
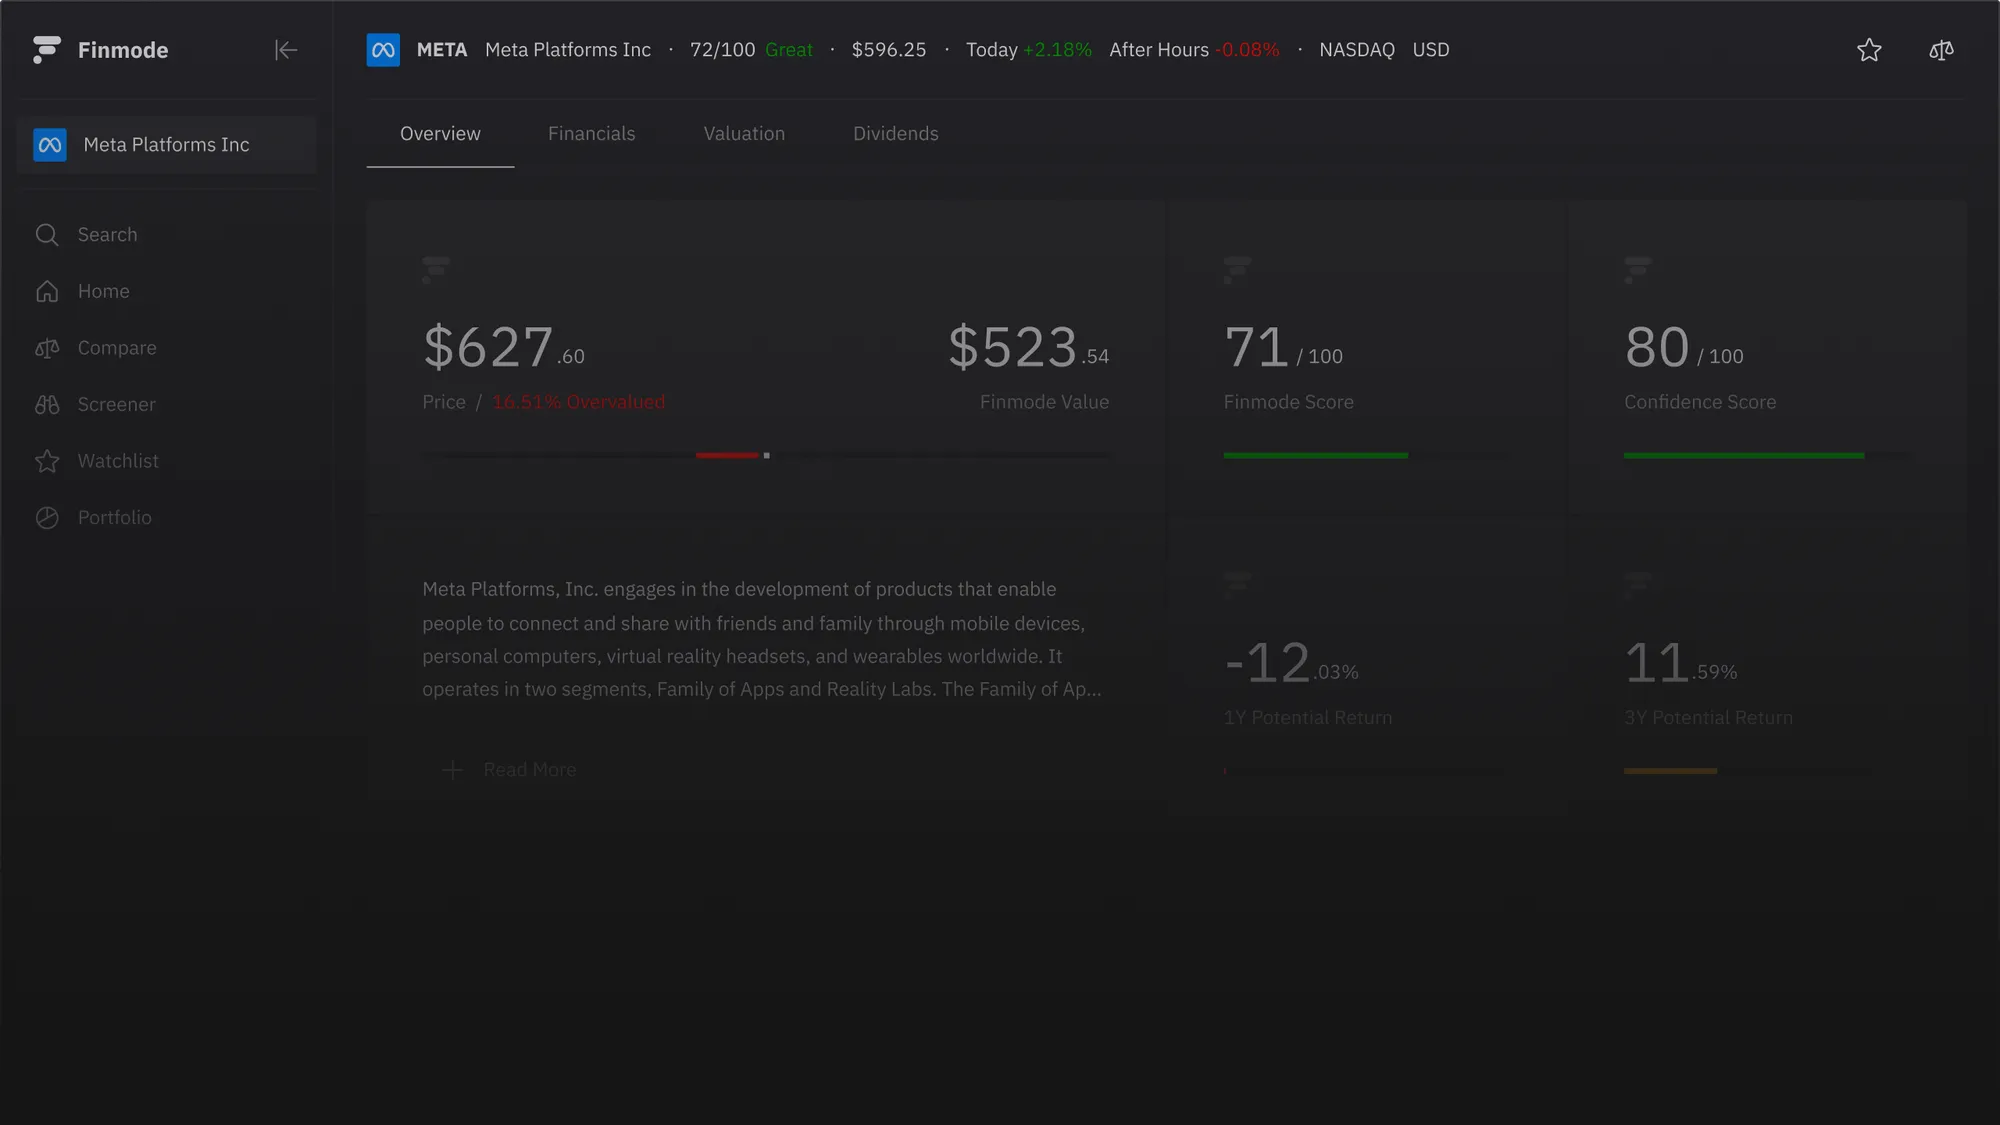
This final number is your estimate of the company's intrinsic value per share. You then compare this to the current market price to determine if a sufficient margin of safety exists. We calculate this value inside the Finmode Terminal as well: we refer to this result as the Finmode Value and it's paired with our Finmode Scores to give you a holistic overview of the health of an organisation.
A Simplified DCF Example: "Steady Eddie Inc."
Let's walk through a basic example. Assume we're analyzing a stable, predictable company.
Assumptions:
- Current Year FCF: $100 million
- FCF Growth (Years 1-5): 5% per year
- WACC (Discount Rate): 9%
- Perpetual Growth Rate (g): 2.5%
- Total Debt: $200 million
- Cash: $50 million
- Shares Outstanding: 100 million
Calculation:
- Terminal Value:
- FCF in Year 6 = 130.82M
- TV = 2,012.62M**
- Present Value of Terminal Value:
- PV of TV = 1,308.20M**
- Enterprise Value:
- EV = 1,308.20M (PV of TV) = **$1,755.71M**
- Equity Value:
- Equity Value = 200M (Debt) + 1,605.71M**
- Intrinsic Value Per Share:
- Intrinsic Value = 16.06 per share**
If "Steady Eddie Inc." is currently trading at $10.00 per share, our analysis suggests it is significantly undervalued with a margin of safety over 37%.
Beyond DCF: Other Methods to Triangulate Value
No single model is perfect. Smart investors use multiple methods to build a range of potential values, a process known as triangulation. This builds conviction and helps avoid errors from relying on a single set of assumptions.
- Dividend Discount Model (DDM): Similar to a DCF but uses future dividend payments instead of free cash flow. It's most useful for mature, stable companies with a long history of paying and growing dividends, like utility companies or blue-chip consumer staples.
- Comparable Company Analysis (Relative Valuation): Instead of calculating intrinsic worth, this method values a company by comparing it to its peers. You look at metrics like Price/Earnings (P/E), Price/Book (P/B), or EV/EBITDA for similar businesses and apply those multiples to your target company. This is a quick way to gauge market sentiment but is susceptible to market bubbles.
- Asset-Based Valuation (Book Value): This method calculates a company's value by summing its assets and subtracting its liabilities. It's most relevant for asset-heavy industries like banking, insurance, or industrial firms. It provides a "floor" value for a company, but often understates the value of intangible assets like brand and intellectual property.
The Art and Science of Valuation: Key Considerations
Valuation is a blend of precise calculation and informed judgment. The DCF model is a powerful tool, but its output is only as good as the inputs you feed it.
- "Garbage In, Garbage Out": Your intrinsic value estimate is highly sensitive to your assumptions, especially the discount rate and perpetual growth rate. Overly optimistic growth forecasts will lead to an inflated valuation.
- Perform a Sensitivity Analysis: To combat this, create a range of values based on different scenarios (e.g., Base Case, Best Case, Worst Case). See how your intrinsic value changes if you adjust the WACC by 1% or the growth rate by 0.5%. This shows you which assumptions have the biggest impact.
- The Importance of the Narrative: The numbers in your model should tell a story about the company's future that is grounded in reality. Why will it be able to grow at that rate? What is its competitive advantage? A strong qualitative understanding must support your quantitative analysis.
How Finmode Streamlines Intrinsic Value Calculation
As you can see, a proper DCF analysis requires gathering extensive data and performing numerous calculations. It's a time-consuming but essential process. This is where modern financial analysis tools become indispensable.
Finmode is designed to automate the heavy lifting of valuation. Our platform provides:
- Standardized Financial Data: Instantly access 10+ years of cleaned, standardized financial statements, eliminating hours of manual data entry.
- Built-in Valuation Models: Run DCF, DDM, and comparable analysis models in seconds. Adjust key assumptions on the fly to perform sensitivity analysis and see how value changes.
- Data Visualization: Our custom charts and graphs help you instantly grasp a company's historical performance and future potential, making your analysis faster and more intuitive.
Stop wrestling with spreadsheets. Start making better investment decisions with Finmode. Explore Our Scores
Conclusion: Your Anchor in a Volatile Market
Calculating intrinsic value is not about finding a single, perfect number. It's about developing a disciplined process for thinking about a business's long-term worth. This process forces you to be rational when others are emotional, to be patient when others are frantic, and to focus on the business fundamentals that truly drive value over time.
By mastering the DCF model and supplementing it with other valuation methods, you build an analytical anchor that will keep your portfolio grounded during the market's inevitable storms. You learn to ignore the noise and focus on what matters: buying wonderful companies at a fair price.
Read more insights
Try Finmode Today
Free To Get Started
While we strive to provide accurate and reliable information, the content provided on this platform is for informational purposes only and should not be construed as financial advice. The information contained herein is based on data and analysis that we believe to be accurate and reliable, but it is not guaranteed to be complete or error-free.
No Investment Advice:
The information provided does not constitute a recommendation to buy, sell, or hold any security. Any decision to invest in any security should be made based on your own research and analysis, or with the assistance of a qualified financial advisor.
Risk of Loss:
Investing in stocks involves significant risk, including the potential for loss of principal. Past performance is not indicative of future results.No
Warranty:
We make no warranties, expressed or implied, as to the accuracy, completeness, or reliability of the information provided. We are not liable for any losses or damages, direct or indirect, arising from the use or reliance on the information provided.
User Responsibility:
It is your sole responsibility to evaluate the accuracy, completeness, and reliability of the information provided and to make your own investment decisions.
FINMODE S.R.L - DOGLIANI (CN) PIAZZA VITTORIO GRASSO 12 - P.IVA 04164500045 - N.REA CN - 340581 - CAP. SOCIALE 15000€